Why this blog?
Until this moment I have been forced to listen while media and politicians alike have told me "what Canadians think". In all that time they never once asked.
This is just the voice of an ordinary Canadian yelling back at the radio -
"You don't speak for me."
email Kate
Goes to a private
mailserver in Europe.
I can't answer or use every tip, but all are appreciated!

Katewerk Art
Support SDA
Paypal:
Etransfers:
katewerk(at)sasktel.net
Not a registered charity.
I cannot issue tax receipts
Favourites/Resources
Instapundit
The Federalist
Powerline Blog
Babylon Bee
American Thinker
Legal Insurrection
Mark Steyn
American Greatness
Google Newspaper Archive
Pipeline Online
David Thompson
Podcasts
Steve Bannon's War Room
Scott Adams
Dark Horse
Michael Malice
Timcast
@Social
@Andy Ngo
@Cernovich
@Jack Posobeic
@IanMilesCheong
@AlinaChan
@YuriDeigin
@GlenGreenwald
@MattTaibbi
Support Our Advertisers

Sweetwater

Polar Bear Evolution

Email the Author
Pilgrim's Progress

How Not To Become A Millenial

Trump The Establishment
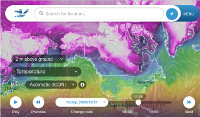
Wind Rain Temp
Seismic Map
What They Say About SDA
"Smalldeadanimals doesn't speak for the people of Saskatchewan" - Former Sask Premier Lorne Calvert
"I got so much traffic after your post my web host asked me to buy a larger traffic allowance." - Dr.Ross McKitrick
Holy hell, woman. When you send someone traffic, you send someone TRAFFIC.My hosting provider thought I was being DDoSed. - Sean McCormick
"The New York Times link to me yesterday [...] generated one-fifth of the traffic I normally get from a link from Small Dead Animals." - Kathy Shaidle
"You may be a nasty right winger, but you're not nasty all the time!" - Warren Kinsella
"Go back to collecting your welfare livelihood. - "Michael E. Zilkowsky


What amazes me is the sequence of the temperature changes! Imagine the stock market was that predictable!!
Every hundred years, I can’t wait for the next one.
But, wait a second.. isn’t it getting colder because the c02 is actually making the world hotter but the ocean is colder and that makes wind colder and stuff? And this graph is only December but other months are wayyy more warmer than usual? And this is only England but other places are super-hot? Anyhow, I guess it doesn’t matter because until they invent the hydrogen engine with free gas pumps, I’ll keep heating my house with coal and filling my tank with fossil fuel.
“Record Warm Temperatures in the Forecast”
http://www.cfra.com/?cat=1&nid=78093
…-
“Low
-1 °C
-10 °C
-13 °C
-14 °C”
http://weather.canoe.ca/Weather/CityOttawaON.html
Doesn’t matter. The new and improved Global Warming Causes Climate Change and Climate Chaos with Extreme Weather Theory is a “Heads I Win, Tails You Lose” game.
Add “Anthropological” to the beginning of the new and improved theory because that is the key claim…all present and future weather/climate events are directly attributed to humans.
If global warming is real why can’t someone just use the actual temp of an area, the daily recorded high and low, plot it on a graph and show us that the temp is getting warmer. I admit I do not have a complete grasp of climate science but I think if it is getting warmer, colder or staying the same, such a graph would show what is actually happenig in that area. Does this sound ok or am I missing something?
According to the cbc,today is ‘National Sweater Day’ and they highly recommend turning the thermostat down..and put that sweater on! Put one on your dog too! Good Lord,are we that dense,Mother Corp has to tell us to dress warmly now?
BTW,re the frozen windfarms in Maritimes,caught a discussion on this on cbc radio last night (As It Happens).the spokesperson for the company that built the frozen fans said they are looking at ‘solutions’ that include ‘putting wires on the blades like on rear widow de-foggers’ or ‘having helicopters fly over and spray hot water on the blades!’..who is going to pay for that expense? Will it even work? Anyone know the going hrly rate to rent a chopper? NOT cheap.
And that’s with the thermometer next to the hot air vent over the barbecue in the sun over the nice black asphalt driveway. Imagine if they hadn’t diddled all the sensor sites, eh?
I’m more worried about the troubles encountered at WUWT trying to actually access the data. It seems the met office, rather than undertaking efforts to make the data more accessible is actually trying to bury the data. How long until some climate zealot decides it’s in “humanity’s best interests” to simply make it disappear? If HADCRUT can “lose” all their data, why not the met office?
Hence the need to coin the phrase “climate change.” Whether temps are getting warmer or colder, it’s a problem, one that government must try to resolve by coercion and the expenditure of trillions of tax dollars because no other organization on earth can be trusted save the state.
AGW
Al’s Getting Worried
I’m very confused and if anyone can shine the LED flashlight on my turmoil and banish it, I would be grateful.
1. The Air Quality index for Prince Albert seems perpetually stuck at 3. It doesn’t matter if it’s smoky, clear, early or late. Where do they measure “air” in Prince Albert that it’s always 3 but hardly ever 2 or even 4? I lived in Ontario where 3 was perceptibly uncomfortable for sensitive types. I don’t detect a particle of noxious anything in the clean, snow-scrubbed PA air. (It’s 3 now as I write.)
2. The same Environment Canada site tells me that last night it snowed 393 mm. I make that 39 cm. There’s lots of snow but not that much.
3. Did I not read that Saskatoon can’t get reliable precipitation figures because they “can’t get enough reliable volunteers to measure it”? This suggests several questions. Don’t we give Environment Canada enough money to do their own measurements? Or are they too busy investigating climate change? I don’t suppose you need accurate data for that. Do they use volunteers for many such measurements?
Anyway, I’m baffled.
Global cooling is clear evidence of global warming.
Sammy @12:53
Last I checked, a Jet Ranger was at least $1200 per hour, so spraying those big fans would be costly.
My suggestion: clad the fan blades in polar bear hides; they seem to do a good job of keeping polar bears warm.
Rabbit: Perfect.
Rita, here’s my attempt to answer your questions:
1. I don’t think they measure it in winter, but I could be wrong.
2. That’s the precipitation amount measured after the snow has been melted. There are different ratios of what that would translate to in terms of measured snowfall, depending on the density of the snow (light and fluffy versus heavy and wet).
3. Opinion alert: I think this is to measure beyond what the official figures display. There are official weather stations that EC monitors, but they are only a point measurement. If they want broad data coverage that would be representative, they have to get volunteers. I don’t know if they still do, but they used to have a Weather Watchers program, but it was focused more on reporting severe events.
Let us see now,
Compare this chart that shows the temperature go up and down in sort of cycles, every so often it will get warmer and then, every so often get will colder, nothing out of the normal fluctuations.
Now, have a look a story in today’s Calgary Herald, “ Man-made global warming linked to heavy rains”, By Margaret Munro.
http://www.calgaryherald.com/news/made+global+warming+linked+heavy+rains/4299275/story.html
There, right in the article you will find wise men telling other people that the sky is really falling. You won’t be able to actually get to any real meat of the argument; you will find the wise guys running around in circles, as though, to avoid saying anything that would support their position.
So you will find something like “Human influence is more pervasive than just a response in surface temperature,” sez one Francis Zwiers, of the University of Victoria. They, the wise guys then plugged the formula of their creation and of course got the answer they expected, one can only imagine how many times they revised the code to come up with the right answer.
In another part of the article, Zwiers tells this: “Our results provide, to our knowledge, the first formal identification of a human contribution to the observed intensification of extreme precipitation,” Key phrase being “to our knowledge”, sounds like pretty good “out”.
Then again, another wise guy, Pardeep Pall, of the University of Oxford, tells that ….greenhouse gas emissions substantially increased the odds of the 2000 flooding “with a likely increase in odds of about a doubling or more.” Using highly sophisticated terminology such as “odds” and “likely”, one can see that he must of course be right. “It is an “open question” as to whether greenhouse gases played a role in those events, the researchers say.” “Open question”, another argument that nailed the fact of AWG.
Finally the scientists get to the real reason why there is AGW:
Climatologist Myles Allen “… says the research is … important because of international funding needed… “
And now, you know why, there is AGW.
Thanks Another Calgary Marc. It would make sense that they don’t monitor air quality in the winter. However, if that’s the case, they should remove that category from the page or put N/A beside it.
393 mm of precipitation (whether it is measured before or after it melts down) is a colossal amount. I think someone missed a decimal point somewhere.
I still find it absurd that they would rely on volunteers to report on the amount of precipitation in a large center like Saskatoon.
The following is an excerpt from a recent CBC report:
22/01/2011 1:00:07 PM
CBC News
“Incomplete records of snowfall in Saskatoon are being blamed on a lack of reliable volunteers, a senior climatologist with Environment Canada says.
…..
Phillips said Environment Canada relies on a network of volunteers to collect data on snowfall. However in Saskatoon some information is missing because the volunteers are not out with rulers every day.”
Lev
Yep, Big money, turns into big cons.
Where ever money pools, there the Vultures perch.
The politicians lie.
Rita, you’re welcome (for what it’s worth).
Full disclosure: I wouldn’t trust Phillips to tell me the sky was blue without checking first.
That said, you may be right on the decimal error. I didn’t check. It would be explainable with a few feet of heavy snow, but I have no idea how much you actually got yesterday at the official measuring station.
Re: the volunteers…I don’t know. Like I said, there are official weather stations in S’toon where these things are measured “for the record”. I believe he’s talking about data points for snow-cover measurements, and the station in Saskatoon is so small now (if it still exists…it was already being reduced long ago, and I worked there as a summer student in the Nineties), that they have to rely on others to bring them the data. My two cents’.
// 60 years have passed since the last time a coldest month record was broken [& this december didn’t quite make it] //
Of course they don’t just do december temperatures —
// Trends Revealed by the Series
Annual Mean temperature
During the 18th and 19th centuries, a cool period which coincided with snowy winters and generally cool summers, the temperatures fluctuated widely but with little trend. From 1910, temperatures increased slightly until about 1950 when they flattened before a sharp rising trend began in about 1975. Temperatures in the most recent decade (years 2001-2010) were markedly higher in all seasons than the long-term average. //
“Examining the above grids on the left, there are only 4 years (see red rectangles) from last 10 years that exhibit ‘top-ten’ warming growth (degrees per century growth rate from the trend/slope). As can be seen, for the 30-year time periods, years 2007, 2006 and 2008 achieved top-ten slots but the rest of grid was taken up by 18th century years. Other than the year 2004 in the 10-year time period, the grids are void of recent years that we were told represented galloping warming.
Moving on, the graph on the right is displaying all 60-year periods and their respective growth trends (degrees per century growth rate). The right-side of the curve reveals the most recent years having 60-year spans of faster warming. But is this warming acceleration exceptional or extraordinary versus the past? Again, the early to mid-18th century (left-side of curve) truly is the era of unmatched “accelerated” warming, and unprecedented, absolute temperature change, as ‘C3’ posts (parts one & two) have documented.
Why did we choose the 60-year time periods to graph? It’s now been 60+ years since CO2 emissions have exploded (1946 was the first large jump in human CO2 emissions). Global warming alarmists claim that years of human CO2 emissions have caused a “runaway” growth in temperatures. Even after 60+ years of CO2 growth, that claim rings hollow when compared to the pre-industrial growth rate of temperatures.”
http://www.c3headlines.com/2010/01/central-england-temperatures-runaway-warming-during-the-last-decade.html
I’m sure Gore will find fault with this graph. It looks like a cartoon of hemorrhoids. The fluctuations is like the stock exchange tables.
One unknown factor is the accuracy and positioning of the thermometers – it’s been reported that the sensors are turned so as to obtain maximum reflected radiation rather than random, making use of black body radiation effect.