Why this blog?
Until this moment I have been forced to listen while media and politicians alike have told me "what Canadians think". In all that time they never once asked.
This is just the voice of an ordinary Canadian yelling back at the radio -
"You don't speak for me."
email Kate
Goes to a private
mailserver in Europe.
I can't answer or use every tip, but all are appreciated!

Katewerk Art
Support SDA
Paypal:
Etransfers:
katewerk(at)sasktel.net
Not a registered charity.
I cannot issue tax receipts
Favourites/Resources
Instapundit
The Federalist
Powerline Blog
Babylon Bee
American Thinker
Legal Insurrection
Mark Steyn
American Greatness
Google Newspaper Archive
Pipeline Online
David Thompson
Podcasts
Steve Bannon's War Room
Scott Adams
Dark Horse
Michael Malice
Timcast
@Social
@Andy Ngo
@Cernovich
@Jack Posobeic
@IanMilesCheong
@AlinaChan
@YuriDeigin
@GlenGreenwald
@MattTaibbi
Support Our Advertisers

Sweetwater

Polar Bear Evolution

Email the Author
Pilgrim's Progress

How Not To Become A Millenial

Trump The Establishment
Wind Rain Temp
Seismic Map
What They Say About SDA
"Smalldeadanimals doesn't speak for the people of Saskatchewan" - Former Sask Premier Lorne Calvert
"I got so much traffic after your post my web host asked me to buy a larger traffic allowance." - Dr.Ross McKitrick
Holy hell, woman. When you send someone traffic, you send someone TRAFFIC.My hosting provider thought I was being DDoSed. - Sean McCormick
"The New York Times link to me yesterday [...] generated one-fifth of the traffic I normally get from a link from Small Dead Animals." - Kathy Shaidle
"You may be a nasty right winger, but you're not nasty all the time!" - Warren Kinsella
"Go back to collecting your welfare livelihood. - "Michael E. Zilkowsky

I knew it! Proof that it’s all down hill from here…
I’m sure that Justine will bring it up at his next press conference.
Oh, wait….
chart has no meaning…
or explanation..della
“chart has no meaning…
or explanation..della”
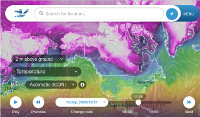
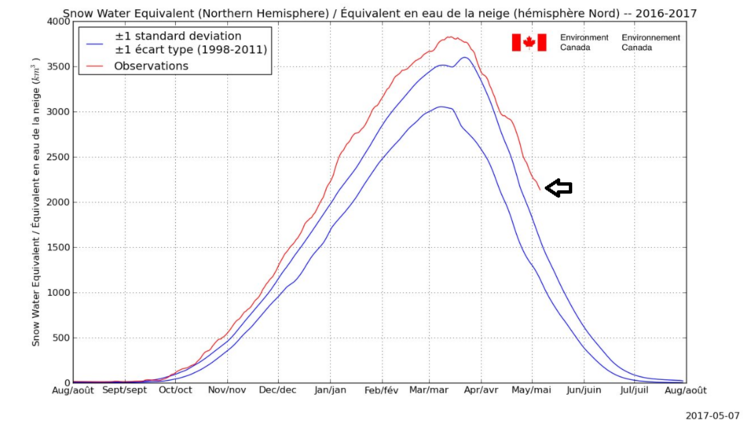
Snow (water equivalent) in the Northern Hemisphere has been more than one standard deviation above average, all season.
Link to original, please. I want to see how Environment Canada spins this.
These kinds of graphs and data accompanying get swatted away as being “weather” by the cultists. Anything that supports their cause is of course damning evidence of impending doom that can only be averted by paying higher taxes on breathing.
I don’t understand that chart … what does it mean … in Plain English …. what?
If the planet has a fever why am I wearing a fleece jacket on this May day in Eastern Ontario?
“what does it mean … in Plain English …. what?”
Snowfall in the northern hemisphere significantly above average last winter. Like 2 standard deviations above the mean. That’s a lot.
It is highly likely, based on the climate history of the last 500,000 years, that the glaciers will once again smear virtually all terrestrial life off much of the Northern hemisphere. The only question is whether it will take 100 years, a 1000 years or 10,000 more years to happen. It’s too bad that, thanks to socialized (politicized) education and research, the (global) trillion and a half dollars per annum directed at CAGW will ensure impoverishment long before we have to worry about our reception in attempting to cross the Rio Grande from the North.
So the chart illustrates the EXTREME weather brought on by Climate Change, cum Global Warming … PROOF of your Co2 sinfulness. Your SINS against Gaia are literally making her CRY! /sarc. off
I’m no statistical expert but assuming a normal (i.e. bell curve) distribution 1 standard deviation contains roughly 68% of the measured data points. There are of course outlier events (i.e. El Nino’s & La Nina’s) that result in data outside 1 standard deviation. For example the 2016/17 graph shows snow quantities more than a standard deviation above average. But not having seen the previous year’s graph (2015/16) in a strong El Nino year that had a very warm and dry winter I suspect that graph would test the below average standard deviation boundary. I’ve been telling those who know me for years that natural processes have cycles – nothing moves in a straight line. Regression to the mean in an closed system with no significant external forcing or major structural changes is what I expect to see so I’m not surprised at the excessive snow this year in the Northern Hemisphere. Average weather seldom happens but measured over a long enough time period the weather certainly averages out.
Note that on the beginning of March the observation is about 2 standard deviations above the mean. 95% of observations would be expected to be within 2 standard deviations, meaning 5% would be expected to be outside of 2 standard deviation with 2.5% expected to be higher. We have a one in forty year occurrence. My stats might be a bit rusty.
The chart is timeline of how much water is in the snow currently on the ground on in the entire northern hemisphere of Earth. Between the blue lines is about 68% of past measurements, 1998 to 2011 in this case. Being above the top blue line says the amount is more than roughly 84% of the measurements in past years. That means there has been a lot more snow than “usual” this year — but only compared to a 14-year range.
Meanwhile, O’Bummer flies by jet to deliver a speech:
http://www.thegatewaypundit.com/2017/05/obama-travels-climate-change-speech-via-private-jet-14-car-convoy-helicopter-protection-video/
The plane, as you’ll note, was just for starters.
We, the Great Unwashed, however, are supposed use clotheslines to dry our laundry and either walk or use bikes instead of driving.
It must be nice to be an arrogant, self-serving liberal….
Thank you … I suppose some evidence of that is the flooding in Kelowna as the over-sized snow pack melts and rushes down the mountain side … My brother has been sand bagging around his house. …
I have believed that we are more likely to experience some cooling rather than warming … warming is my first choice ….
So if it cooling we are heading for … will we be getting our carbon tax money back?
Proof that the seas are melting and falling on the land. We will all sink and drown!
So if it cooling we are heading for … will we be getting our carbon tax money back?
No, silly. They’ll double it because it was such a success.
Here’s a link from “WattsUpWithThat” that shows trends equal or greater to the 0.38C/year warming trend identified in the period between 2006 to 2016 over the past 2000 years:
https://wattsupwiththat.com/2017/05/10/video-analysis-of-nasa-data-shows-modern-temperature-trends-are-not-unusual/
There were many periods identified over the last couple of millennia that show similar or greater warming trends. So the argument that the 2006 to 2016 warming trend is unique is eco-branded hogwash. It exposes the well used fraud of cherry picking data to suit the narrative with no effort to shore up justification through rigorous analysis. But when have religious zealots ever used rigorous analysis when burning heretics or sinking them in rivers with stones does a much better job at silencing debate?
“…Snowfall in the northern hemisphere significantly above average last winter. …”
I don’t much care about the northern hemisphere’s snow overall, locally I didn’t get enough work clearing snow. More snow, please, and dammit.
“… will we be getting our carbon tax money back?” Not a chance. It has been spent hiring more government worker union types.
The omens are good.
Any day now I expect to see some “expert” on the Weather Channel and CBC standing with their back to a flood gauge ,prattling on about Biblical Floods.
Just like the CBC bimbo of a couple years back, I keep forgetting to search out the video, I believe it was spring floods on the upper Fraser,classic dumb activist/reporter but smart camera crew..3 past floods shown on old gauge all yards higher than the panic of the moment.
But it will be..”Unprecedented”!!